|
|
You are here: DAMASK>Documentation>Processing>PostProcessing>VTKAddRectilinearGridData


2.2.4. vtk_addRectilinearGridData
Purpose
Add scalars, vectors, and/or an RGB tuple froman ASCIItable to existing VTK rectilinear grid (.vtr/.vtk).Usage
> vtk_addRectilinearGridData options file[s]
Options
-
--vtk - VTK file name
-
-r/--render - open output in VTK render window
-
-d/--data - scalar/vector value(s) label(s)
-
-t/--tensor - tensor (3x3) value label(s)
-
-c/--color - RGB color tuple label
Examples
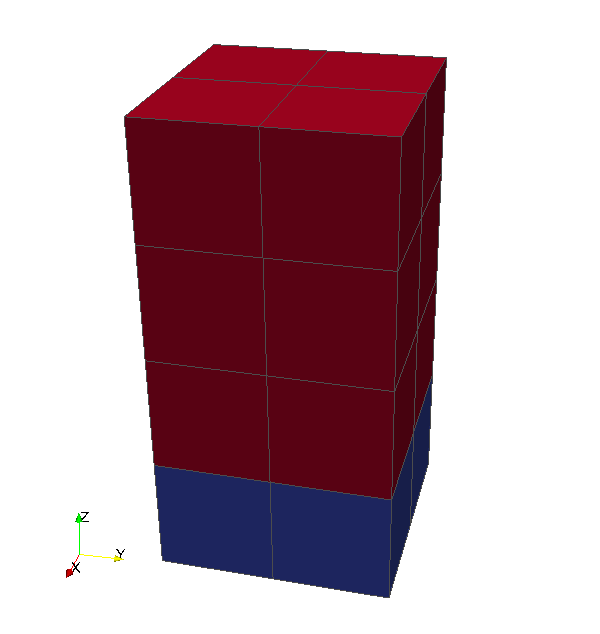
For an exemplary ASCII table1 header 1_pos 2_pos 3_pos microstructure 0.5 0.5 0.5 1.0 1.5 0.5 0.5 1.0 0.5 1.5 0.5 1.0 1.5 1.5 0.5 1.0 0.5 0.5 1.5 2.0 1.5 0.5 1.5 2.0 0.5 1.5 1.5 2.0 1.5 1.5 1.5 2.0 0.5 0.5 2.5 2.0 1.5 0.5 2.5 2.0 0.5 1.5 2.5 2.0 1.5 1.5 2.5 2.0 0.5 0.5 3.5 2.0 1.5 0.5 3.5 2.0 0.5 1.5 3.5 2.0 1.5 1.5 3.5 2.0the addition of the scalar quantity »microstructure« to the cell-centered and point-centered interpretation (
--mode) of the coordinates results in gridded data as shown in Figure 1.
| ||||
| Figure 1: Rectilinear data grids following from above ASCII table. Blue and red correspond to values of 1 and 2, respectively. |


| I | Attachment | Action | Size | Date | Who | Comment |
|---|---|---|---|---|---|---|
| |
cell-centered-data.png | manage | 5 K | 04 Dec 2015 - 03:46 | PhilipEisenlohr | Cell-centered grid with data |
| |
point-centered-data.png | manage | 13 K | 04 Dec 2015 - 03:45 | PhilipEisenlohr | Point-centered grid with data |
Edit | Attach | Print version | History: r5 < r4 < r3 < r2 | Backlinks | View wiki text | Edit wiki text | More topic actions
Topic revision: r5 - 09 Dec 2021, FranzRoters

- News
- 14 Sep 2020
-
CMCn2020 & DAMASK user meeting to be hosted at Max-Planck-Institut für Eisenforschung(cancelled) - 22 Aug 2020
- Release of first preview version of DAMASK 3
- 19 Feb 2020
- DAMASK made it to the Advanved Engineering Materials Hall of Fame
- 26 Mar 2019
- DREAM.3D 6.5.119
(released 2019/03/22) comes with a DAMASK export filter - 25 Mar 2019
- Release of version v2.0.3
- 21 Jan 2019
- DAMASK overview paper finally published with full citation information available
- 01 Dec 2018
- DAMASK overview paper now online
- 17 Sep 2018
- CMCn2018 & DAMASK user meeting to be hosted at Max-Planck-Institut für Eisenforschung
- 22 May 2018
- Release of version v2.0.2
- 01 Sep 2016
- CMCn2016 & DAMASK user meeting to be hosted at Max-Planck-Institut für Eisenforschung
- 25 Jul 2016
- Release of version v2.0.1
- 08 Mar 2016
- Release of version v2.0.0
- 22 Feb 2016
- New webserver up and running
- 09 Feb 2016
- Migrated code repository from Subversion to GitLab
- 17 Dec 2014
- Release of revision 3813
- 14 May 2014
- Release of revision 3108
- 02 Apr 2014
- Release of revision 3062
- 16 Oct 2013
- Release of revision 2689
- 15 Jul 2013
- Release of revision 2555
- 15 Feb 2013
- Release of revision 2174
- 13 Feb 2013
-
 documentation
- 16 Dec 2012
-
 rendering
- 23 Nov 2012
- Release of revision 1955
- 15 Nov 2012
- Release of revision 1924
- 01 Nov 2012
- Updated sidebar
- 30 Oct 2012
- Significant website updates and content extensions
Ideas, requests, problems regarding DAMASK? Send feedback
§ Imprint § Data Protection